
Between 1965 and 1985, the average annual Australian road toll stood at 3,378 – arguably the most dangerous periods on our national roadways.
Thanks to better driver education, stricter laws around drink driving and seatbelt wearing, and improved driver safety technology, this average over the twenty-year period between 2001 to 2021 dropped to 1,379 – 41% of what it was back then.
Even so, we have a long way to go to get to zero.
As Road and Highway Authorities around Australia encourage drivers to head Towards Zero – a year without road fatalities – the 12 months to April 2023 saw 1,204 deaths on Australian roads, an increase of 50.
The latest statistics from Bureau of Infrastructure and Transport Research Economics recorded 106 road deaths in Australia in May 2023, and 1,202 deaths over the past 12 months.
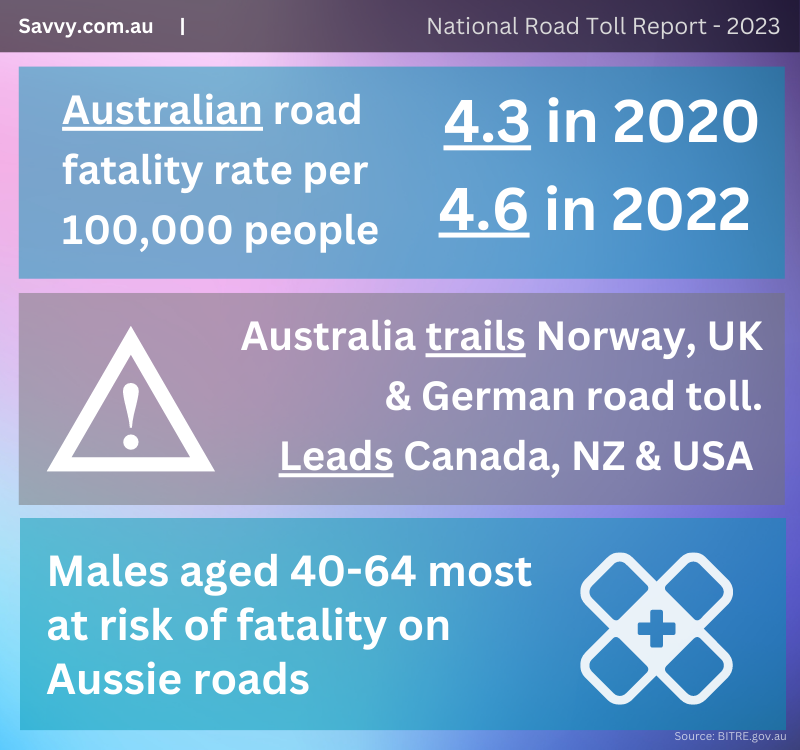
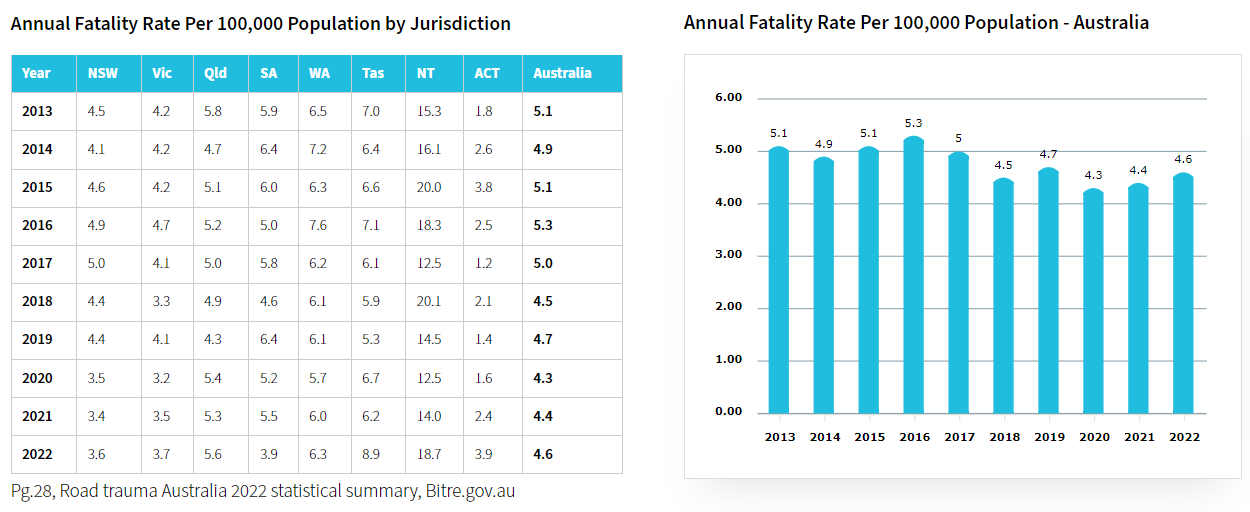
This represents an annual fatality rate of 4.6 per 100,000 population. This represents an unbroken chain of annual decreases since 1995, where it stood at 11.76 per 100,000 (barring two slight increases in 2000 and 2005.)
By drilling down into the statistics, we’ll take a look at the trends and latest information on the road toll in Australia, including changes in the various states, age groups, and the proportion of road users that make up the road toll.
- Most statistically probable fatality is a male vehicle driver between the age of 40 to 64 years of age
- National road toll for 12 months to April 2023 was 1,204, up 4.3% from last year
- 14.7% increase of Australian road fatalities among women over previous 12 months
- Most road deaths recorded by drivers of vehicles (48.6%)
- Deaths per 100,000 population stood at 4.6, which has been decreasing since 1995
- Australia is ranked 20th out of the 36 OECD countries for road fatalities
Australian National Road Toll
As mentioned, the Australian national road toll up to April 2023 stood at 1,204.
This was a change of 4.3% over the previous year.
This was a slight increase on previous years with 1,154 in 2022, 1,116 in 2021 (a ten-year low), and 1,125 in 2020.
870 men lost their lives in road accidents compared with 327 women. Interestingly, this was a 14.7% increase in road fatalities among women over the 2022-23 period.
The lower figures for 2020 and 2021 may be explained by lower road usage during COVID-19 lockdowns in major population centres such as Victoria and New South Wales.
The ten-year high from 2014 was in 2016, with 1,262 deaths recorded.
The majority of deaths by road user were the drivers of road vehicles at 46.8%, followed by motorcyclists (19.5%) and vehicle passengers (16.2%). Pedestrians accounted for 13.6% of all road fatalities.
Broken down by demographics, the largest proportion of fatalities fell between the 40 to 64 age bracket, with 376. This was followed by 26 to 39s on 263, and 17 to 25s on 224.
New South Wales Road Toll
The NSW road toll for the last 12 months to April 2023 was 296 fatalities, up 2.1% from last year on 290. This was broken down into 213 road deaths among males and 83 among females – an 18.6% increase on last year.
The ten-year low was in 2021 with 279; ten year high in 2018 recorded 406 deaths.
The majority of road users involved in a fatal incident were vehicle drivers, at 136 (45.9%), followed by pedestrians (20.6) and vehicle passengers (15.5%).
Again, the highest age demographic represented in the NSW road toll was the 40 to 64s with 81. This was followed by 17 to 25s on 54 and 26 to 39s on 52.
Victoria Road Toll
Victoria recorded 266 road deaths over the 12 months to April 2023, a 10.4% increase over 2022. 195 of these were men, a 14.7% change on the previous year.
65 women lost their lives to fatal road accidents, an 8.5% decrease over 2022. The ten-year high was in 2017 with 280, and the ten year low in 2021 with 200.
45.5% of all fatalities were recorded among vehicle drivers. 18.8% of fatal accidents were among motorcyclists, followed by vehicle passengers on 16.2%.
The Victorian Road toll again showed that the 40 to 64 age cohort showing the highest proportion of road fatalities with 74 recorded for 2023. This was followed by 26 to 39s on 64, and 17 to 25s on 46.
Queensland Road Toll
Queensland recorded 280 deaths resulting from road accidents in 2023, a 1.1% increase across the board. 65 women lost their lives, a 3% decrease from the previous year.
214 men lost their lives, which resulted in a 2.4% increase over the previous years.
Far and away the largest demographic represented in the Queensland road toll was the 40 to 64s on 93, with the results skewing toward 26 to 39s (70) and 17 to 25s (53).
46.8% of fatalities among road users were vehicle drivers, with 26.8% being motorcyclists, and 14.3% as vehicle passengers.
Northern Territory Road Toll
The NT recorded 34 road deaths up to 2023, down from 45 the previous year, a net decline of 24.4%.
This was slightly above the ten year low of 31 and far below the ten year high of 52.
The highest demographic of road users recording a fatality were vehicle passengers on 32.4%, followed by pedestrians on 26.5%, with drivers coming in at third on 23.5% – an anomaly among the usual statistics.
However, the ages stayed relatively the same, with 10 deaths in the 17 to 25s and 40 to 64s, and 6 in the 26 to 39s.
Tasmania Road Toll
There were 43 road fatalities in Tasmania to April 2023, a decrease of three over last year (6.5%.)
The majority were men (31 vs 12 women.)
The 26 to 39 and 40 to 64 cohort recorded 10 deaths each, with 17 to 25s and over 75s recording six deaths, the top demographics for road fatalities in Tasmania.
55.8% of Tasmanians that lost their lives on the road were vehicle drivers, followed by 18.6% being passengers and 16.3% being motorbike riders.
Western Australia Road Toll
178 Western Australian road users lost their lives over the last 12 months to April, a 12.7% increase over last year. 127 men lost their lives – the same amount as last year. 51 women died in WA due to road accidents, a 64.5% increase.
The ten year high in WA road deaths was in 2017 with 188, with the lowest recorded in 2020 with 147.
The 40 to 64 age demographics had the highest proportion of road deaths in WA on 66, with 26 to 39s recording 42, and 17 to 25s recording 30.
48.9% of fatalities were recorded among vehicle drivers, followed by 23% being motorcyclists, and 16.9% as vehicle passengers.
South Australia Road Toll
The South Australian road toll saw 92 people lose their lives to traffic accidents, an increase of 7% over the previous year.
The ten-year high was recorded in 2020 (110) and the ten-year low in 2017 (82). 62 were male, a decrease of 7.5%. 37 women lost their lives on SA roads, an incredible 57.9% increase over 2022 (only 19 deaths recorded.)
The age bracket with the highest proportion of deaths was again the 40 to 64s with 32, almost double the equal second bracket (26 to 39s and 17 to 25s) on 18 respectively.
53.3% of deaths by road user were drivers, 16.3% by motorbike riders, and 13% being pedestrians.
Australian Capital Territory Road Toll
The ACT recorded 15 road deaths over the previous 12 months from April, an increase of 36.4% and a ten year high the lowest ten-year stats occurred in 2018-2019, with six deaths recorded.
Equal numbers of drivers and passengers lost their lives (46.7%) with the remaining death cause unknown.
The majority of road fatalities were among the 17 to 25 demographic on 7, followed by 40 to 64s on 5.
How we compare internationally
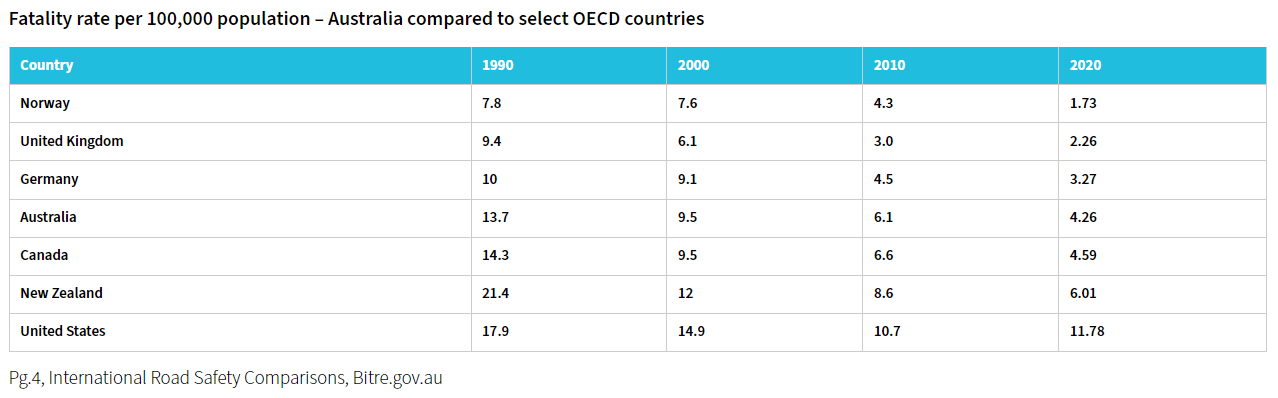
According to BITRE, Australia’s road incident fatality rate was 4.26 per 100,000 population ranked 20th out of the 36 OECD nations (2020).
Between 2011 and 2020, this fatality rate fell by 25.4%, compared with the OECD median of 34.6%.
While we are well behind the UK (2.26 fatalities per 100,000 people) and Germany (3.27), we are still ahead of New Zealand (6.01) and the United States, which has a fatality rate of 11.78 individuals per 100,000 head of population in 2020.
This could also be skewed by statistics from the Northern Territory.
The Northern Territory showed 12.45 road deaths per 100,000 population in 2020, increasing to 17.6 in 2022.
This means a road user is four times more likely to die in a road incident in the NT than the rest of the country.
“If we take out the Northern Territory, which has taken many steps to curb its excessive road toll through tougher penalties and reduced speed limits in remote areas, we fare quite well against the rest of the world in terms of fatality rates,” says Savvy spokesperson Adrian Edlington. “Australia has made great strides since 1995 to combat the road toll. Continued driver and road user education, improved safety features in cars, and upgraded infrastructure will all contribute to reducing the road toll to as close to zero as possible.”
40- to 64-year-old vehicle drivers – the most likely road toll statistic
Though conventional wisdom would have us believe the younger, less experienced driver cohort would have higher fatality statistics, it seems that the 40–64-year-old demographic are more likely to be represented in the national road toll, barring some outliers.
The most common fatality on Australian roads would be a male vehicle driver between the ages of 40 to 64.
No matter your age, you should never drink and drive or drive if you are feeling the effects of fatigue.
If you are driving long distances, you should make use of rest stops and take 15-20 minute “power naps” to ensure you are refreshed and alert. It could end up saving your life.


